|
January 14, 2004
Prepared by Dr Greg
Constable, CSIRO Cotton Research Unit, Myall Vale Research
Station, Narrabri and the Cotton Seed Distributors (CSD)
Extension & Development Team, Adam Kay, Robert Eveleigh, John
Marshall and Craig McDonald
 This
article is aimed at presenting and discussing the merits of
monitoring some aspects of fruiting dynamics. This
article is aimed at presenting and discussing the merits of
monitoring some aspects of fruiting dynamics.
That information is useful in cool seasons to determine whether
crop development has been up to potential and may enable
identification of sluggish crops which need to be pushed. It is
important to make such a diagnosis early otherwise crop setback
and delay may impact on yield and maturity.
In the last 10 to 20
years there have been many developments based on new
understanding of cotton’s morphology and physiology. This
monitoring facilitates a better assessment of crop development
status. When done correctly and at the right time this can
enable corrective management to prevent or correct any problems.
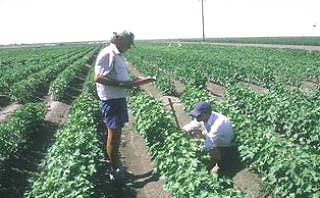
Pictured above: New
CSIRO breeding lines are assessed for agronomic management
requirements. This picture shows monitoring squaring nodes (SN)
and Vegetative Growth Rate (VGR).
There are many measurements to monitor a cotton crop. Some of
the more common and important data are:
1. Insect scouting for incidence, abundance and impact of pests.
2. Moisture status to accurately schedule irrigation.
3. Nutrient status to diagnose fertiliser requirements.
4. Plant mapping:
a) node numbers and plant height to estimate vegetative growth
rate and possible growth regulator application
b) numbers of sites, squares and bolls
c) retention of fruit on important node positions,
d) nodes above white flower (NAWF) and nodes above cracked boll
(NACB) to measure crop cutout or maturity.
Obviously many of
these measurements can be done at the same time. For example, if
insect scouting indicates a large number of mirids present, it
may be important to assess whether fruit have been lost, ie: by
measuring retention and/or total fruit numbers.
 Theory,
measurement and experience indicate a number of important key
events should be expected in a cotton crop. Theory,
measurement and experience indicate a number of important key
events should be expected in a cotton crop.
1. The first fruiting branch is expected on about the 7th
mainstem node of most Australian varieties. About 500 day
degrees will have elapsed by this stage.
2. Fruiting branches appear at regular intervals of about 45 day
degrees.
3. On a well grown crop with little insect damage, by the time
of first flower there are about 8 fruiting branches present (
NAWF = 8). These 8 branches will provide the bolls contributing
to a large proportion of final yield, and these bolls generally
will have the best fibre quality. If there are fewer than 8
nodes above white flower at the beginning of flowering, yield
potential is often reduced and it maybe too late to recover.
The measurement of
squaring nodes in a young cotton crop can be a useful tool for
monitoring the early development of crops and can give an early
indication of any stresses that may ultimately reduce the nodes
above white flower (NAWF) when flowering commences. This method
has been used successfully by the University of Arkansas in the
development of the COTMANTMExpert System.
The squaring node
measurement can therefore give an early indication of potential
problems and allow early remedial action rather than waiting
till the crop flowers before realising there maybe a problem.
The measurement can
commence at squaring or 500 day degrees and be carried out
through to flowering at 800 day degrees and then nodes above
white flower can be monitored through to cut out (3-4 NAWF) at
around 1100 day degrees.
 The
theoretical values for number of squaring nodes (SN) and nodes
above white flower (NAWF) at diff e rent accumulated day degree
levels is shown in illustration above. The
theoretical values for number of squaring nodes (SN) and nodes
above white flower (NAWF) at diff e rent accumulated day degree
levels is shown in illustration above.
The theoretical values
of Figure 1 provides a framework by which to monitor the crops
progress, by graphing day degrees and squaring nodes against it.
A variation of monitoring squaring nodes is to count squares;
This data is also very valuable and is analagous to the original
SIRATAC Yield Development Thresholds.
The squaring node
number should be used in conjunction with fruit retention when
making decisions.
High or low square
retention can greatly influence the significance and the
interpretation of the squaring node curve.
Where a crop is
consistently on or just above pink line it indicates the crop is
on track. Measurements well above can indicate the need to
evaluate the need for growth regulators.
 Measurements
well below the line indicate a problem with the crops
development that may require a management solution ie: water,
fertiliser etc. Measurements
well below the line indicate a problem with the crops
development that may require a management solution ie: water,
fertiliser etc.
Reference:
COTMAN™Expert System 5.0
In the case
(illustration above) node development is ahead of schedule, this
is likely caused by optimum conditions after planting or a low
first square position.
If associated with
high fruit retention you need to be ready to meet the demands of
fruit. If retention is low you may need to monitor VGR
(Vegetative Growth Rate) to see if a growth regulator is
required.
In the
case (illustration right) node development has been delayed.
This can be caused by factors such as seedling disease,
herbicide damage, high first fruiting node, etc.
If associated with
high retention, maintain inputs to get on track. If retention is
low, correct those causes to avoid late maturity. |