Ames, Iowa
April 24, 2009
By Roger Elmore and Lori
Abendroth, Department of Agronomy,
Iowa State University
Plant populations continue to increase and, unfortunately, so do
seed costs. Certainly hybrids today withstand the stress of
higher seeding rates better than ever before. In fact, higher
seeding rates are one component that drove annual yield
increases the last several decades.
The current questions are where and when does the yield
responsiveness to increased seeding rates plateau or stop? If we
consider net return, we arrive at this point once increased
seeding rates no longer cover the additional seed cost.
Since 2006, we have conducted plant population research across
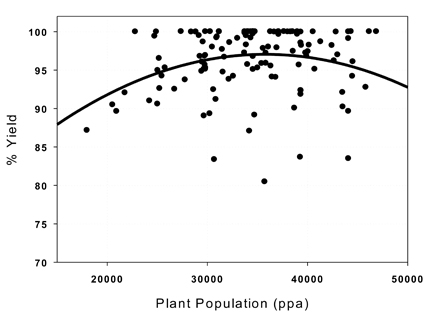
32 sites in Iowa. Figure 1 displays the yield distribution
pattern from these trials expressed as a percent of the maximum
yield across the 32 locations. On average, maximum grain yields
occur between 34,500 and 37,000 plants per acre (ppa); although
there is significant variation across locations and years
(Figure 1). This population range, 34,500 to 37,000 ppa, is
2000-3000 ppa greater than what was found in plant population
research 5 to 10 years ago.
Seed costs have increased substantially. But, donít forget that
transgenic traits add a measure of yield protection Ė herbicide
and insect resistance allowing improved weed and insect
management - as they add to the price of seed. Is there a point
where adding another 1000 seeds per acre does not return the
cost of the increased seed?
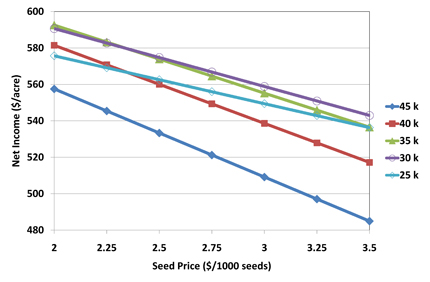
We answer that question by comparing a range of seed costs
actually paid by producers in 2009 with expected yields at
different plant populations based on our 2006 to 2008 data
(Figure 2). As seed prices increase, return to seed decreases.
The best net returns occur with plant populations between 30,000
and 35,000 ppa.
Not every seed that is planted develops into a plant. Our
recorded losses from seeding to plant survival range from 4 to 7
percent. In general, increasing seeding rates by 5 percent will
insure that the proper plant population is achieved. We
recognize that plant survival depends on many factors and may
vary from field to field.
Plant populations between 30,000 and 35,000 ppa optimize yield
while maximizing net income. We continue to process these data
and are also conducting additional plant population trials this
year. Please stay tuned.
| Figure 1. Corn grain
yield as a percent of maximum yield at different plant
populations for 32 sites in Iowa (10-12 locations per
year over three years). Iowa State University 2006-2008. |
|
 |
| Figure 2. Net income
((200 bu/acre grain yield x $3.25/bu) - (seeding rate x
seed price)) at different plant populations with changes
in seed prices (k=1000 seed). Since there are 80,000
kernels in a bag of seed, the range in seed prices here
represent a range in price per bag from $160 to $280;
these are current price ranges paid by growers. Yield
data are based on yield responses at different plant
populations as shown in Figure 1. |
|
 |
Roger Elmore is a professor of
agronomy with research and extension responsibilities in corn
production. Lori Abendroth is an agronomy specialist with
research and extension responsibilities in corn production.
Elmore can be contacted by email at
relmore@iastate.edu or
(515) 294-6655; Abendroth can be contacted by email at
labend@iastate.edu or
(515) 294-5692.
This article was published originally on 4/24/2009 The
information contained within the article may or may not be up to
date depending on when you are accessing the information.
|
|